

Check interval from 60 seconds
Uptime monitoring, hosted in Germany. You hear about the outage before your customers do.
Websites, APIs, ports, DNS, SSL certificates and cron jobs, checked by the minute. When something goes down, the alert goes out on whichever channel you picked for it. Error tracking and public status pages are part of the deal.
No payment details needed · cancel monthly · servers in Germany · GDPR-compliant

- api.myproject.comHTTPS142 ms99.98 %
- db:5432TCP8 ms100 %
- status.myproject.comKEYWORD210 ms99.9 %
- *.myproject.comSSLexpires in 6 days-
- checkout-flowAPI480 ms99.95 %
Monitor types
What UptimeAlien watches
Eleven monitor types. From a plain website to a multi-step API flow, cron jobs included.
Website & endpoint
Status code, response time, and availability of websites and HTTP endpoints.
SSL certificates
Days left, the exact expiry date, and an alert 1 to 90 days before a TLS certificate runs out.
Domain expiry
Warns you weeks before your domain registration lapses. Queried over RDAP, straight from the registry.
Port monitoring
Monitor open ports and TCP services such as databases, SMTP, or SSH.
Ping / ICMP
Host availability and latency via ICMP echo.
DNS resolution
Resolves A records and speaks up on failures or changes.
Keyword
Checks whether an expected text appears in the response (or is missing).
API monitoring
Multi-step HTTP flows with status and content assertions.
UDP services
Sends a payload and checks the response of UDP-based services.
JSON health
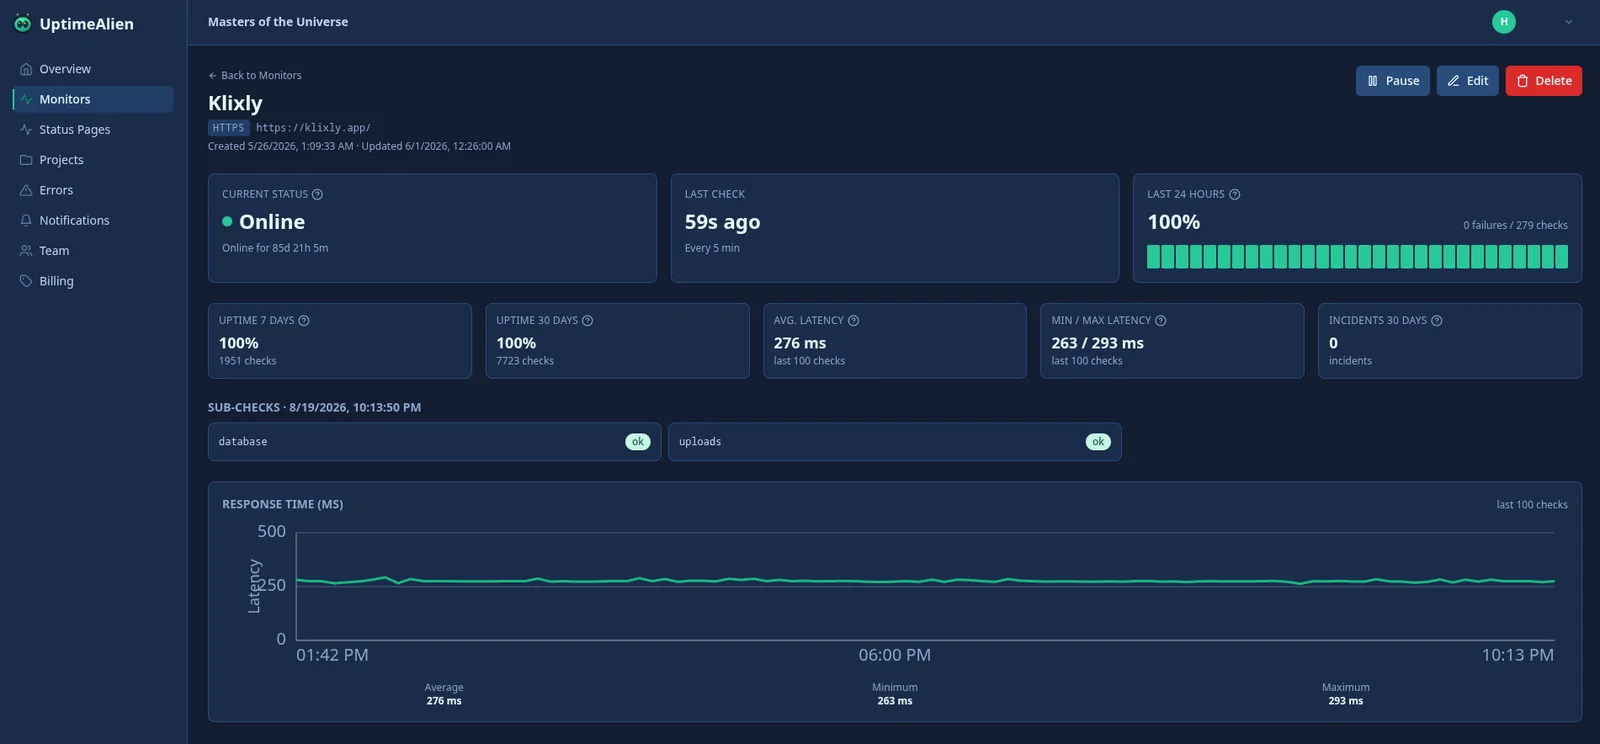
Reads health endpoints and evaluates sub-checks individually.
Cron job & heartbeat
Your job pings us after each run; when the ping stops arriving, the monitor fires.
How it works
How this works
- t+0 sCreated
Create a monitor
Enter a URL, host or port, set an interval and a threshold. Takes under a minute.
- every 60 sCheck running
We check on your schedule
Up to once a minute, from our servers. Response time gets measured on every single check.
- Slack · 12:04Alert fired
Get notified instantly
The alert lands on your channel. Afterwards the dashboard tells you how long the outage lasted and how often it has happened before.
Capabilities
What a status code alone will not tell you
Response times, expiry dates, exceptions, status pages and who on the team may do what. The features one by one.
60-second checks
On the paid plans the check interval drops to 60 seconds. The free tier checks every five minutes.
Learn moreSlow-response alerts
Set a latency threshold: too slow = “degraded”, even before it goes down completely.
Learn moreProduction error tracking
Send error events from your apps to UptimeAlien and keep track of open and resolved errors.
Learn morePublic status pages
Share live status and uptime under your own URL, with your own branding on the Team plan.
Learn moreTeam access
Everyone gets their own login, instead of one password sitting in the team chat.
Learn moreTwelve alert channels
Slack, Discord, Telegram, email, webhook, PagerDuty, Opsgenie, ntfy, Gotify, MQTT, FCM and PushPig.
Learn moreExpiry monitoring
Certificates and domain registrations both run out on a date you already know. Get told before it arrives.
Learn moreAlert channels
Twelve channels for the alert
Slack, Discord, Telegram, email, webhook, PagerDuty, Opsgenie, ntfy, Gotify, MQTT, FCM and PushPig. How many run at once depends on your plan.
- Slack
- Discord
- Telegram
- Webhook
- PagerDuty
- Opsgenie
- ntfy
- Gotify
- MQTT
- FCM
- PushPig
Also available as an Android app
Push notifications on your phone, monitor status while you are out, and acknowledging incidents without opening a browser.
Status page
Public status pages are part of it
My Project: Status
All systems operational- Web app99.98 %
- API99.95 %
- Database100 %
Second pillar
Error tracking: the server answers 200 and something is still broken
An uptime check only ever sees your app from outside. Send us the exceptions from your exception handler and you get to see the inside too.
- Exceptions with stack traces from any language that speaks HTTP. No SDK needed.
- Identical errors sit in one row with a counter. One click resolves the whole group.
- Open and resolved stay apart, so you stop grepping log files.
- Filter by service, environment or release using tags you set yourself.
curl -X POST https://uptimealien.de/ingest/v1/events \
  -H "x-sysmon-key: $UPTIMEALIEN_INGEST_KEY" \
  -H "content-type: application/json" \
  -d '{
    "level": "error",
    "message": "Cannot read property id of undefined",
    "stacktrace": "at CheckoutService.pay (checkout.ts:42)",
    "tags": { "service": "checkout", "env": "production" }
  }'
Questions
Frequently asked questions
What people ask us most often.
No. The free tier is free forever and works without any payment details. You only enter billing data if you later upgrade to a paid plan.
On servers in Germany that we run ourselves. No external host, no third-country transfer. UptimeAlien is GDPR-compliant, and the data processing agreement (DPA) takes effect automatically when you register.
Yes. Paid plans are billed monthly and can be cancelled at any time; your plan stays active until the end of the paid period and then drops back to the free tier.
Nothing breaks and nothing gets charged. You simply cannot add more monitors once you hit your plan's limit. Either upgrade, or pause an existing monitor to free up a slot.
Across twelve channels: Slack, Discord, Telegram, email, webhook, PagerDuty, Opsgenie, ntfy, Gotify, MQTT, FCM and PushPig. The public status page comes on top. Which channel fires for which monitor is your call, per monitor.
Yes. You share a live status page with your users. On the paid plans it takes a theme, your own logo and your own colours, along with uptime history and an incident timeline.
Not for website, port and ping checks: enter a URL and you are done. The advanced types like API flows, JSON health, keyword, SSL and DNS sit there for when you need them. Examples are in the in-app help.
Set up your first monitor
Free and without payment details. If it's not for you, deleting your account is easy enough. Not that we're hoping for that.